Cooking with x64dbg and MCP
Hey space travelers 🚀
I’m sharing a cookbook that will help you level up your reverse engineering + bug hunting with the newly released x64dbg Automate MCP server and x64dbg-skills. We’ll walk through some of the functionality and skills provided, hopefully it will:
- Give you a good idea how to use the x64dbg Automate MCP server
- Help you create repeatable high-level skills on top of the MCP server
- Inspire you to contribute your own skills (PRs welcome!)
Prerequisites
- x64dbg with x64dbg Automate installed
- x64dbg Automate MCP installed
- x64dbg-skills
- (optional) context7
Recipes
- Decompile — Basic discovery and method analysis via decompilation
- State Snapshot & State Diff — Understanding obfuscated code through state diffing
- Tracealyze — Trace-guided in-memory deobfuscation
- Yara Sigs — Fingerprinting cryptographic primitives and signatures
- Context7 — Pulling in live documentation for stronger results
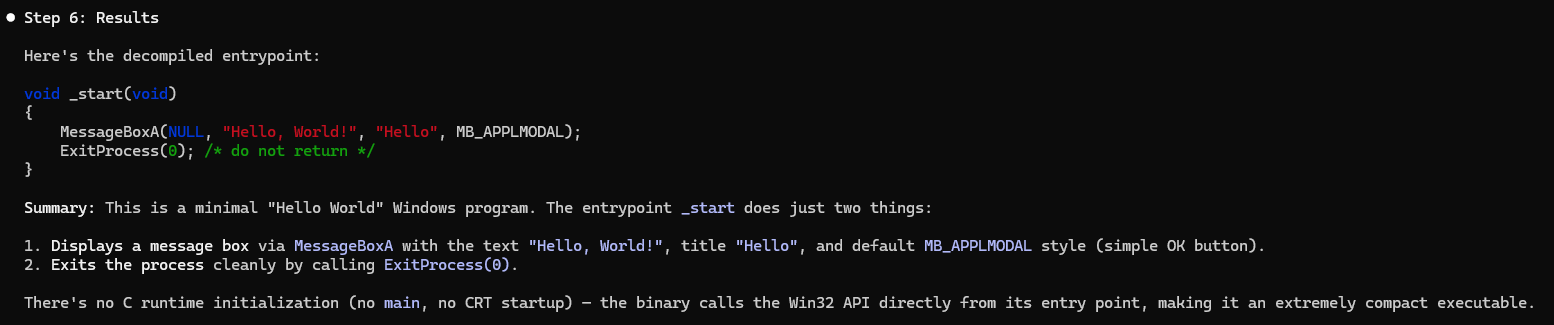
Recipe 1: Discovery with the Decompile Skill
Let’s start by showing how to simply load a binary and analyze a method. Your most basic lightbulb moment might just be seeking somewhere in the codebase and having the agent help you understand the current method and context.
I’m using a single simple prompt here:
debug “C:\re\code\scratch\hello\hello.exe” using C:\re\x64dbg_dev, summarize the entrypoint method
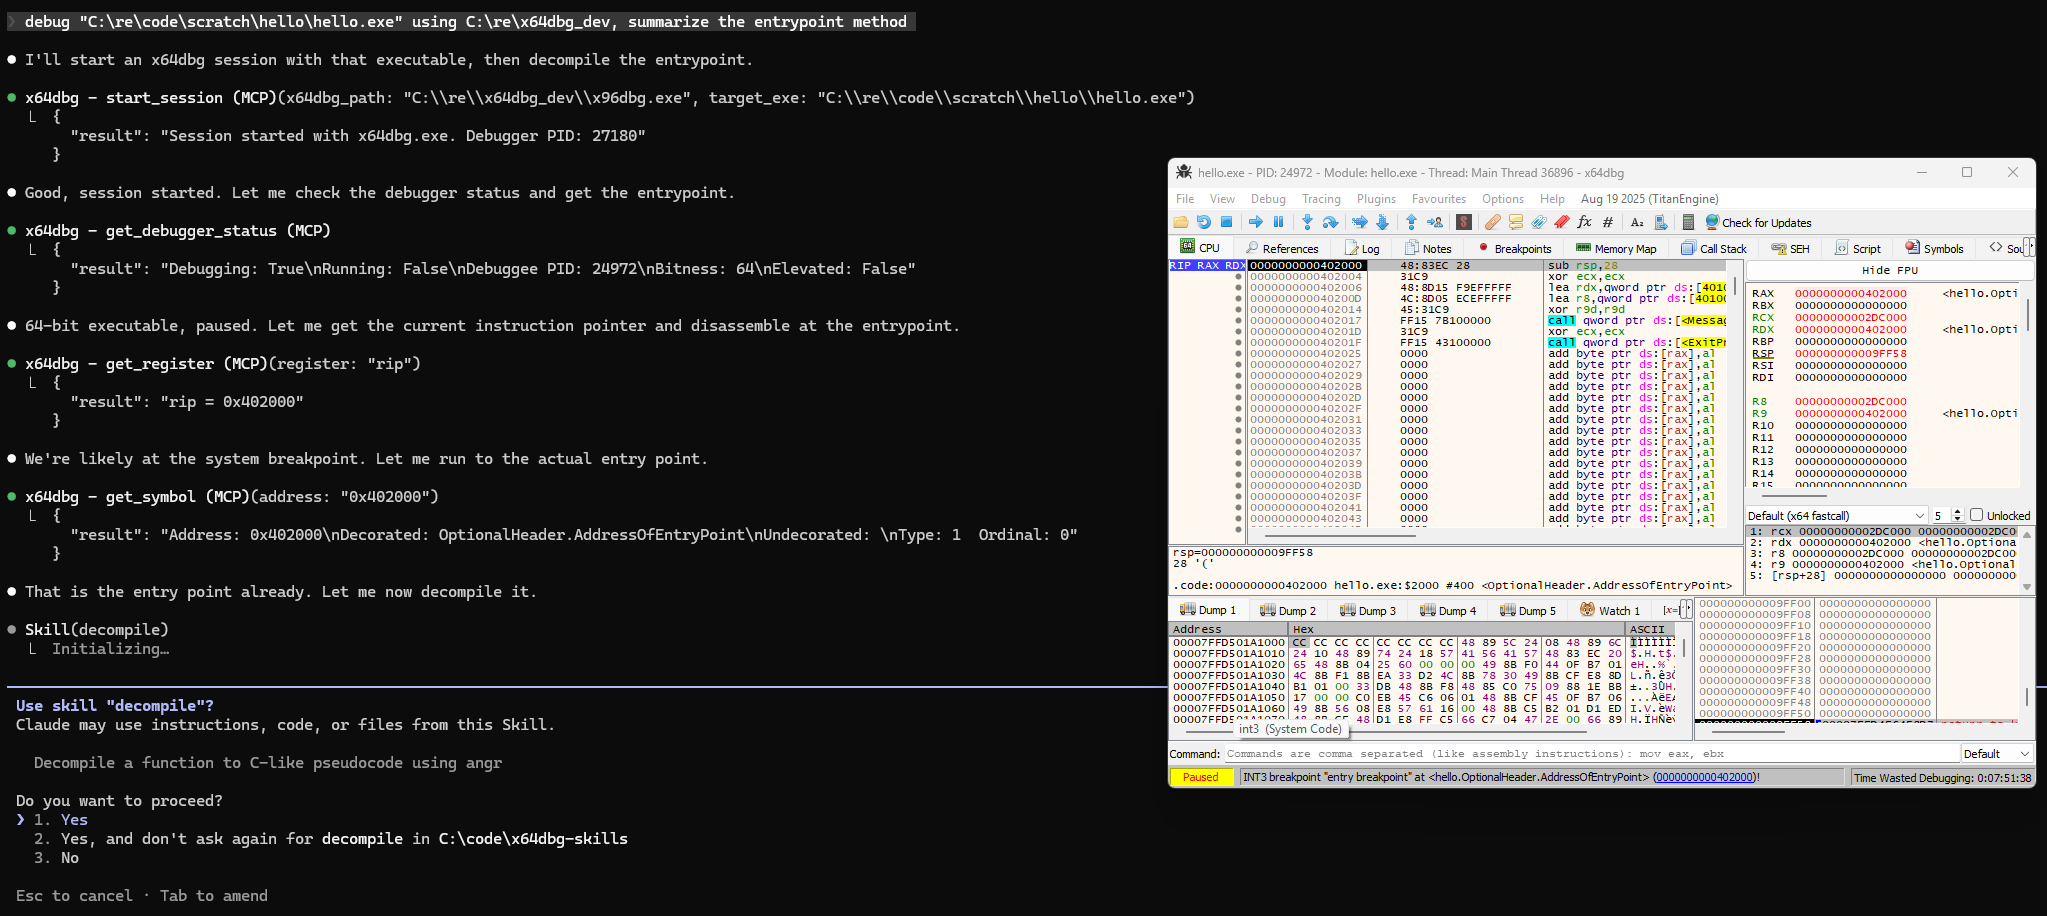
Note with the MCP installed and skills active the agent can easily start a debug session and perform basic analysis without hand holding. Let’s use the decompile skill on the main method and get an idea what this application does.
🔔 The decompile skill is powered by angr, but you could easily bridge to IDA Pro or Ghidra too.
Nice! We now have a convenient way to do some basic fingerprinting / analysis with the debugger MCP tools and the decompile skill. Now on a more complex application you might navigate somewhere and try a prompt like:
Decompile the method at the current instruction pointer, help me understand what it does.
Recipe 2: Discovery with the State Snapshot and State Diff Skills
You may find you have a binary that is resistant to decompilation, and difficult to understand using assembly level analysis. In that case adding context with decompile or trying to grok the current region with raw MCP calls can be prohibitively expensive or difficult.
Consider adding context that helps the LLM understand a region’s behavior by snapshotting the state (memory, register context) and then diffing it after the target region has executed. The LLM can examine how memory and registers changed and get a better understanding what an obfuscated method does.
Step 1: Session and navigation
debug “C:\re\code\scratch\whatami_1\secret_encryptor.exe” using C:\re\x64dbg_dev, give it a command line argument “abcdefg123” and stop at the entrypoint
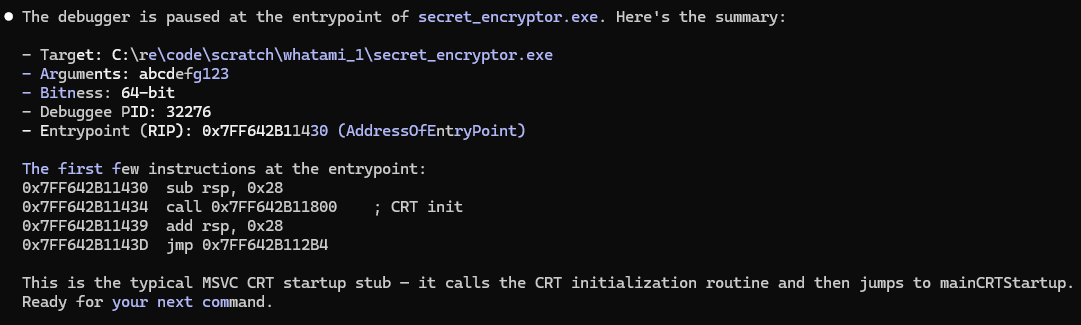
I allowed the target to run to the obfuscated method using the debugger UI at this point.
Step 2: Snapshotting and diffing
I need help understanding the method at RIP. Create a state snapshot, run till you encounter a return opcode, then create another state snapshot. Perform a state diff and use it to help you discover what this method did.
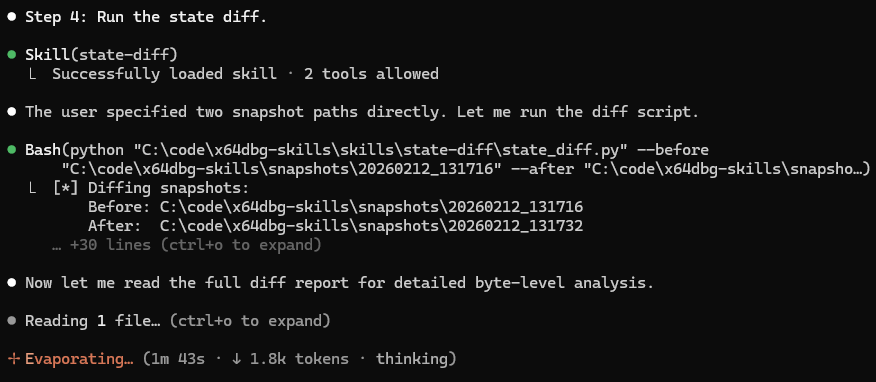
We can see the agent navigating the instructions and diffing two state snapshots.
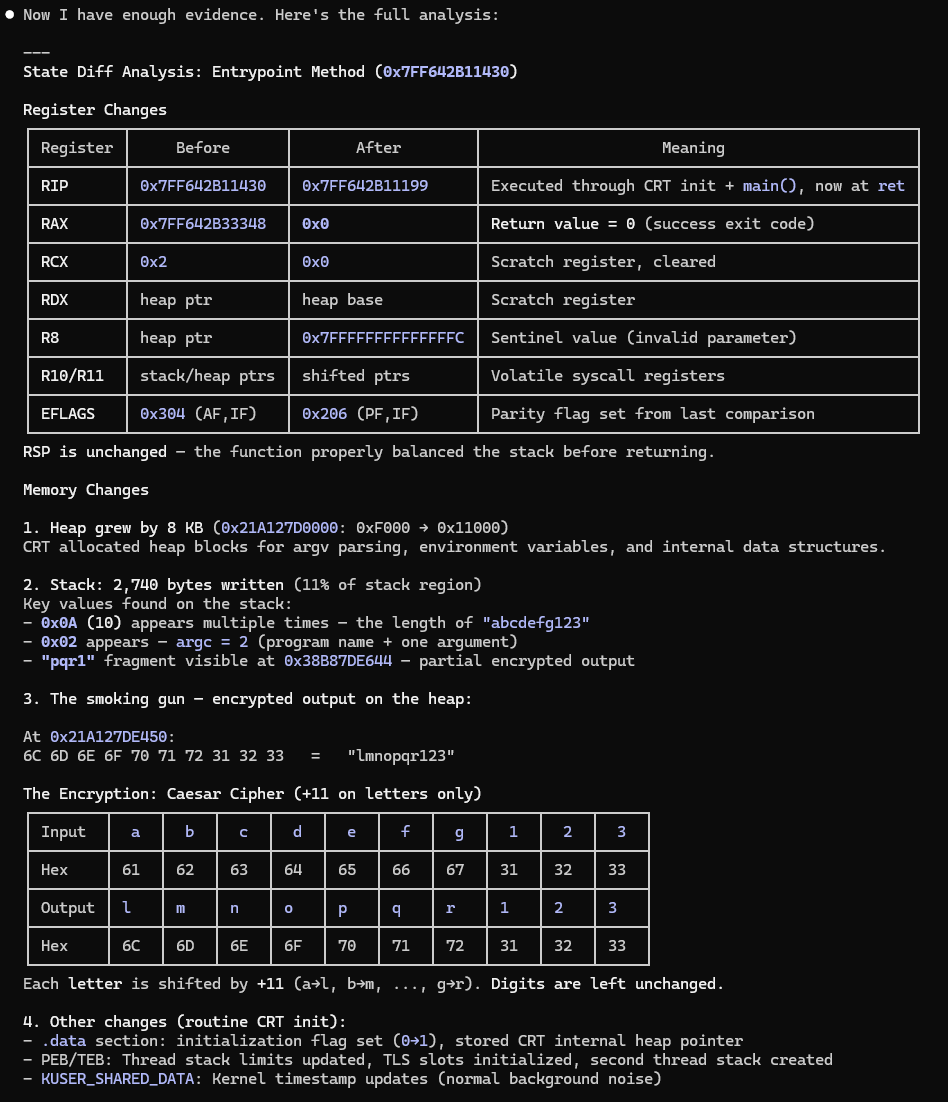
The agent is then able to help extrapolate based on the state change what kind of behavior took place, even with disassembly and decompilation off the table.
Recipe 3: Discovery and Deobfuscation with the Tracealyze Skill
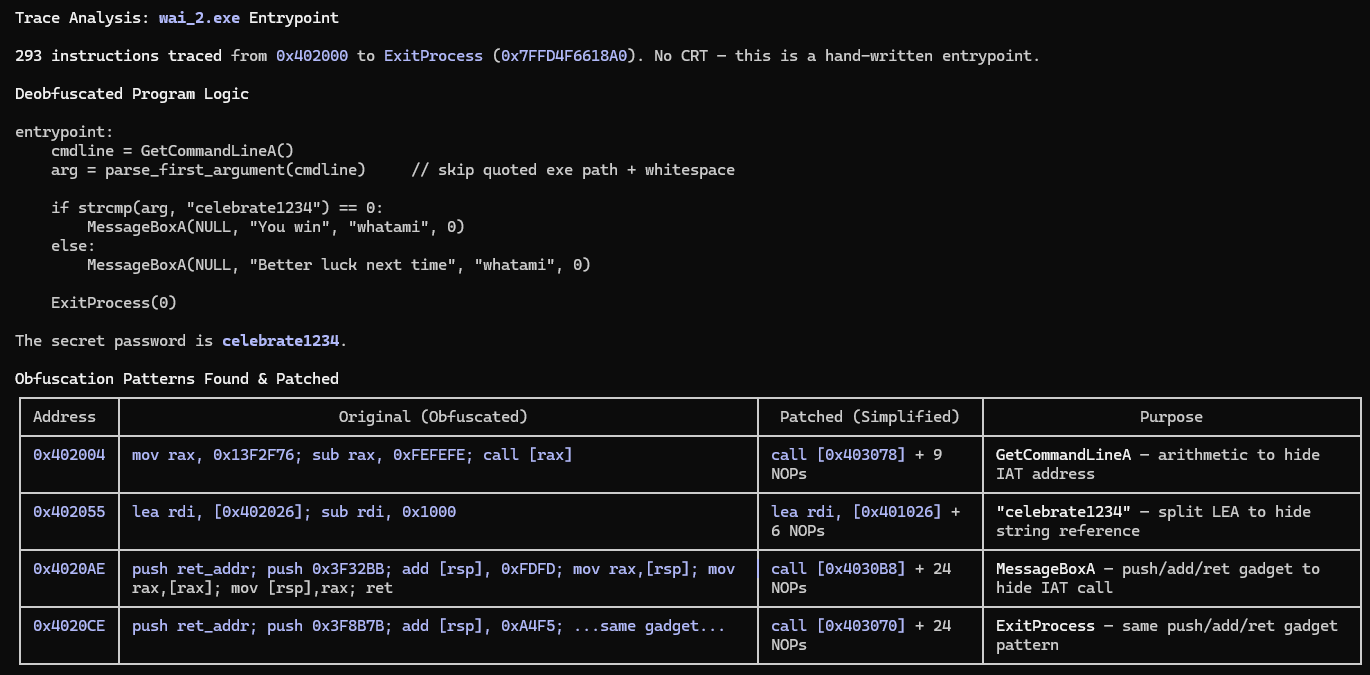
Like the previous recipe, start the target and navigate to an obfuscated method. After that we can ask the agent to perform in-memory deobfuscation and annotation guided by the trace.
The method at the current instruction pointer uses obfuscation to obscure string references and IAT calls. Trace until CIP == ExitProcess. Using the trace log help me simplify the external calls and string references. Annotate where you assembled new instructions in memory.
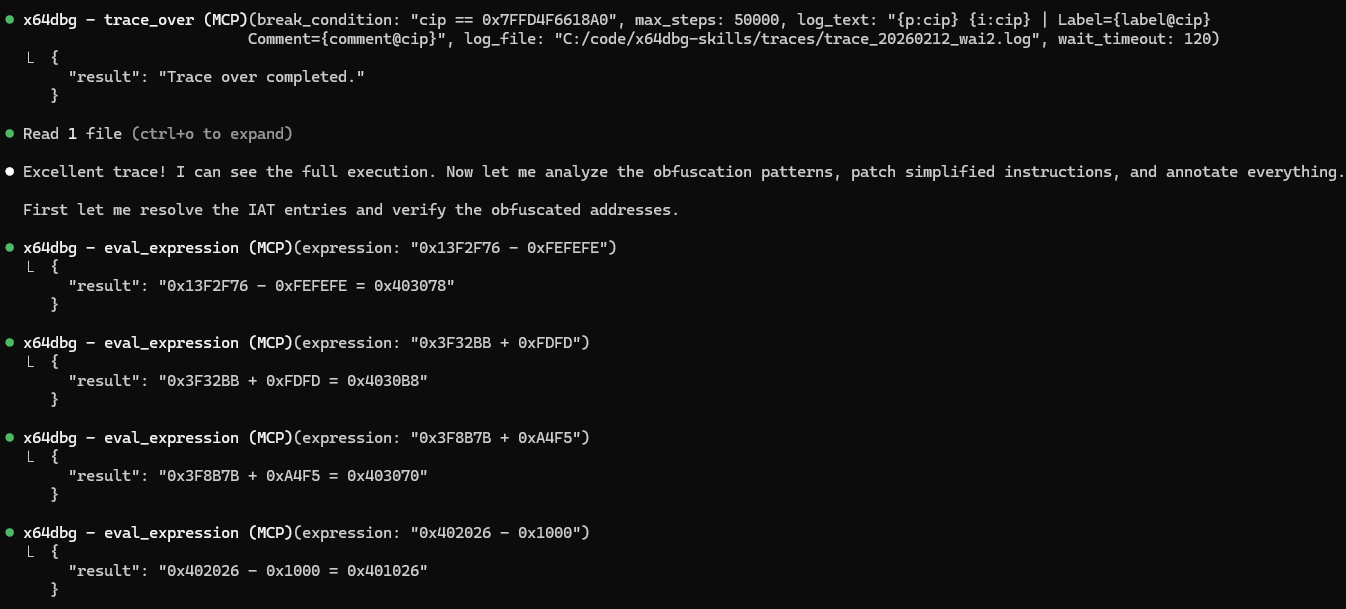
Neat! The LLM is able to use the trace to understand how the target obfuscated strings and external calls.
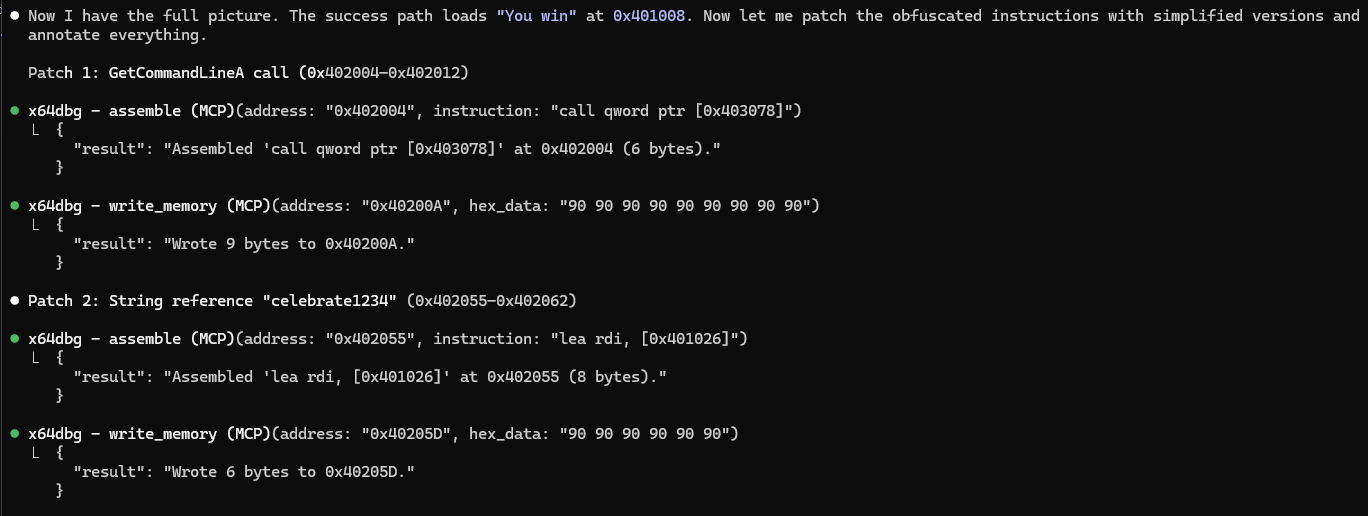
And it’s even able to patch in memory to simplify the obfuscated regions.
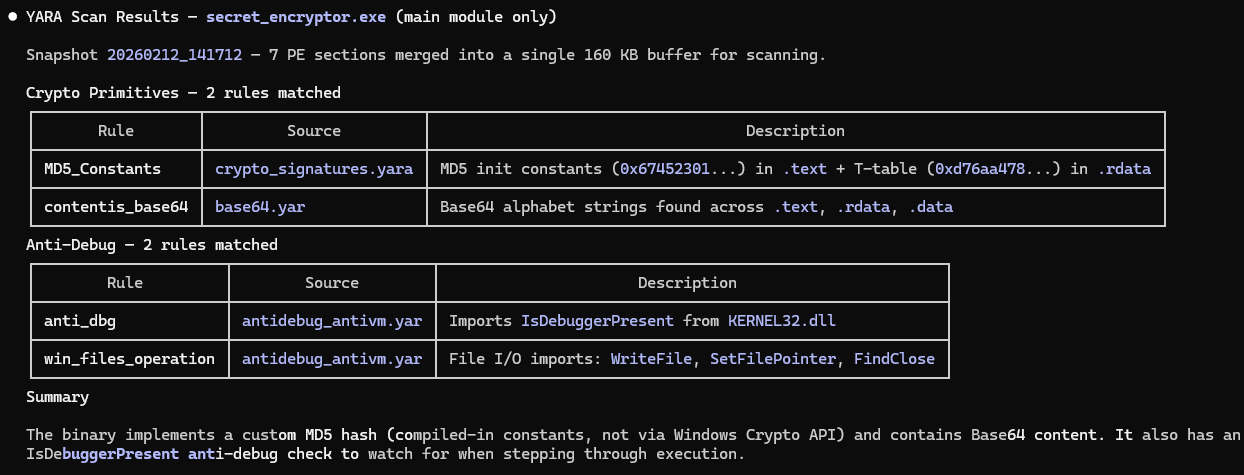
Recipe 4: Fingerprinting with the Yara Sigs Skill
Frequently a target will contain byte signatures of cryptographic primitives, tooling, compressors/encryptors, and similar. The yara-sigs skill can help discover the location of these signatures using x64dbg/yarasigs.
🔔 The yara-sigs skill is particularly useful in tandem with state snapshotting. Targets can be analyzed as-is in memory, which is key for targets that unpack in stages or otherwise obscure their behavior in-memory.
Start the target and continue execution to a state where you suspect the signatures you’re searching for may be present. Then ask the agent to scan for them.
Create a snapshot of the application and search for cryptographic primitives and anti debug techniques using Yara. Only include results from the main module
Recipe 5: Enhanced Usage with Context7
The agent’s effectiveness is heavily influenced by how much relevant context it has. This is where Context7 helps. It’s an MCP server that pulls up-to-date, version-specific documentation directly into the LLM’s context window.
LLMs are trained on static snapshots of the internet. When you ask an agent to use x64dbg Automate’s API, or x64dbg’s native command API the model may hallucinate function signatures, use deprecated patterns, or miss capabilities entirely.
You may find you get better results when using x64dbg Automate if you start with a prompt like:
When you are working with the x64dbg MCP, additional context is available on context7 for x64dbg-automate-pyclient. Use x64dbg’s reference from context7 when working with raw commands.